Document Type : Review Article
Keywords
Introduction
Multiple sclerosis (MS) is an inflammatory demyelinating disease of the central nervous system (CNS), affecting over 2 million people worldwide. Both humoral- and cell-mediated immunity are involved in the pathogenesis of the disease. The first symptoms of MS are presented as isolated flare known as clinically isolated syndrome (CIS) (1, 2). CIS is commonly manifested as partial myelitis, unilateral optic neuritis, motor or sensory symptoms of the brain hemisphere, or brain stem syndrome. Some patients presenting CIS develop MS in the following years; however, other groups of patients would not
|
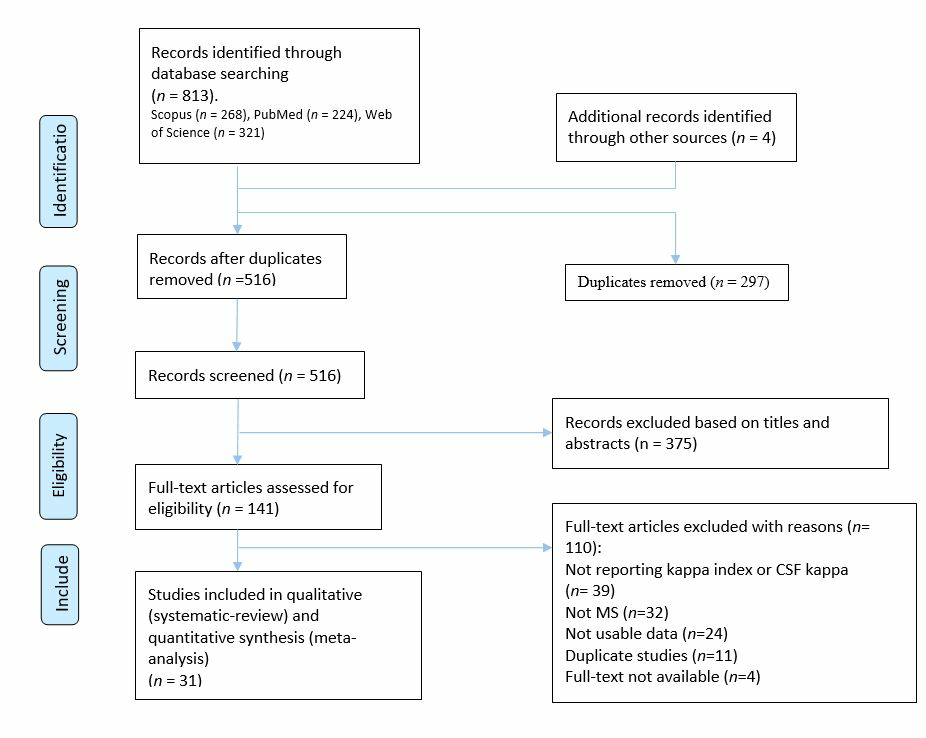
Figure 1. PRISMA flow diagram depicting the flow of information through the different phases of a systematic review
|
develop MS over time (3). A major number of MS patients have a remission period after disease relapse and with disease progression, relapse periods occur more frequently with shorter duration of remission periods (3, 4). Early diagnosis of MS is critical since earlier administration of immune modulatory drugs decelerates MS progression and associated cognitive and disability (5-7).
During neuroinflammatory processes in MS, plasma cells synthesize intrathecal immunoglobulin (Ig). Oligoclonal IgG bands (OCB) of cerebrospinal fluid (CSF) are detected by isoelectric focusing (IEF) and immunoblotting or immunofixation in the next step (8, 9). The latest update to the diagnostic criteria for MS advocates for a multimodal approach that combines clinical findings, CSF analysis, and magnetic resonance imaging (MRI) data to enable a more accurate diagnosis. The revised McDonald criteria stipulate that the identification of two or more OCBs in the CSF serves as a key parameter for the diagnosis of MS (10). Nonetheless, this technique has several constraints that include susceptibility to subjective interpretation, being cost-prohibitive, possessing qualitative rather than quantitative characteristics, as well as requiring considerable labor investments (11-13). Moreover, the specificity of OCB is low, since the intrathecal synthesis of IgG bands occurs in many other neuroinflammatory diseases not just in MS (14). Therefore, it is required to identify additional CSF biomarkers to facilitate earlier diagnosis of MS.
An alternative biomarker with high prognostic and diagnostic power is free light chains (FLC) including kappa (κ) and lambda (λ) FLCs which are synthesized by plasma cells in CSF. Several studies have previously determined FLCs as an alternative biochemical biomarker for the diagnosis of MS (15-17). The presence of κFLC and λFLC in CSF has been known since 1980. (18). During inflammation, immunoglobulins and excess of κ and λ light chains are produced by mobilized B lymphocytes in CSF (19). Healthy individuals have a low concentration of FLCs in the serum and CSF, but their concentration increases during inflammatory processes (20). In addition to κFLC in CSF, κ index (CSF/ serum κFLC divided by CSF/ serum albumin) increased in patients with MS compared to healthy individuals (21). However, still, the value of κFLC quantification for MS diagnosis remains controversial
|
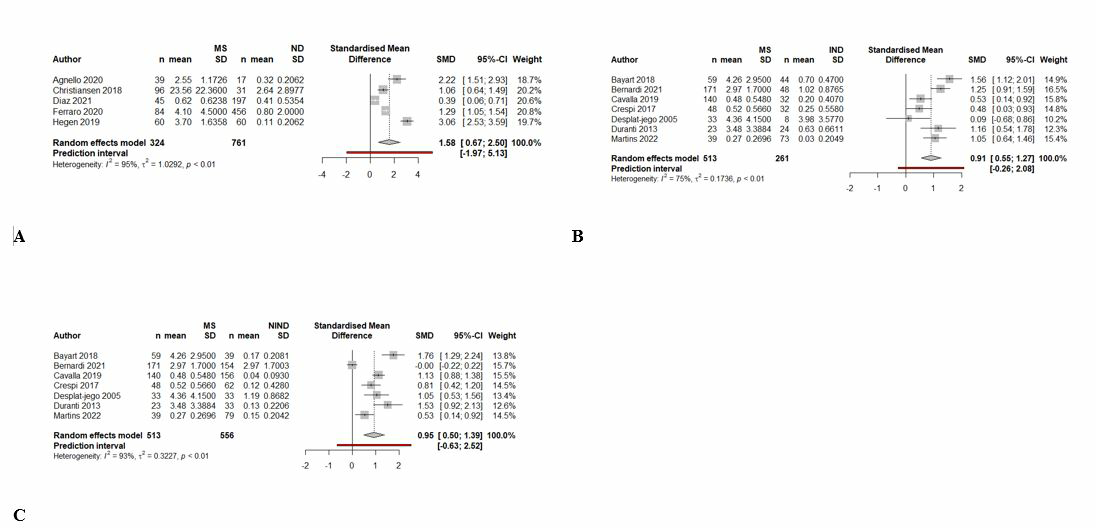
Figure 2. Forest plot of CSF κFLC levels in MS compared to ND (A), IND (B), and NIND (C)
|
and some studies reported that it is less valuable than OCB testing (22-24). This could be due to the different number of participants, different measurement assays, and different administered cut-off values. Rosenstein et al. conducted a study revealing the potential of κFLC as a viable diagnostic tool for MS, with comparable accuracy rates regarding sensitivity and specificity when compared to OCBs (25). Consistently, a recent meta-analysis study indicated that there is no significant difference in diagnostic accuracy of κFLC and OCBs (26).
Early detection of MS presents a vital aspect in managing the disease, leading to better prognosis and improved clinical outcomes. The development of a diagnostic test that effectively detects the presence of MS at the initial stages of the disease could significantly aid in improving patient management strategies. To this end, the search for novel diagnostic tools and methods has been an active area of research in recent years. It was found in previous studies that abnormal CSF κFLC and κ index levels were associated with an increased probability of CIS conversion to MS and also accurate diagnosis of MS (22, 27). Moreover, quantitative κFLC analysis could demonstrate immunological differences between MS and other inflammatory diseases (28, 29). Recently, a systematic review and meta-analysis investigated the diagnostic value of CSF κFLC in MS (30), however since the κ index showed higher accuracy in discriminating MS from CIS and other neuroinflammatory diseases, there is a lack of comprehensive review on the role of κ index in MS diagnosis. In this systematic review and meta-analysis study, we aimed to evaluate the diagnostic value of CSF κFLC and κ index for MS.
|
Table1. Demographic, clinical characteristics, and findings of included studies |
||||||||
|
Author |
Year |
Country |
Study design |
Preanalytical conditions |
Measuring equipment (reactive) |
Type of MS |
Sample size |
Mean age |
|
Agnello et al. |
2020 |
Italy |
Cross-sectional |
−80°C |
Freelite |
RRMS, PPMS, and CIS |
56 |
MS: 32, ND:68 |
|
Ayrignac et al. |
2020 |
France |
Retrospective cross-sectional |
NR |
NR |
NR |
42 |
NR |
|
Bayart et al. |
2018 |
Belgium |
Cross-sectional |
NR |
FreeLite |
RRMS, PPMS, and SPMS |
142 |
45.8 |
|
Bernardi et al. |
2021 |
Italy |
Cohort |
Centrifuged (10min 3000g and 2000g ), stored (−20°C, −40°C, or −80°C) |
Freelite MX |
NR |
406 |
37 median |
|
Cavalla et al. |
2019 |
Italy |
Cross-sectional |
Optimum concentration 20 mg/L in saline |
N Latex FLC (Siemens) on BNII nephelometric automated analyzer |
RRMS, PPMS, and CIS |
373 |
46.3 |
|
Christiansen et al. |
2018 |
Denmark |
Prospective cross-sectional |
Rutine samples (-70˚C) |
FreeLite |
RRMS, PPMS, and CIS |
230 |
40 median |
|
Crespi et al. |
2017 |
Italy |
Cross-sectional |
NR |
N Latex FLC kappa/lambda Kit and BN II System |
NR |
150 |
51 |
|
Crespi et al. |
2021 |
Italy |
Cross-sectional |
NR |
BN II nephelometer |
NR |
667 |
72.9 |
|
Desplat-jego et al. |
2005 |
France |
Cross-sectional |
−80◦C until FLC assays |
BN II nephelometer |
RRMS/PMS |
89 |
35 median |
|
Diaz et al. |
2021 |
Spain |
Cross-sectional |
−80◦C |
Freelite Mx |
NR |
252 |
44.12 |
|
Duell et al. |
2020 |
Sweden |
Cross-sectional |
NR |
BN II nephelometer |
RRMS |
112 |
43 |
|
Duranti et al. |
2013 |
Italy |
Cross-sectional |
−20 °C |
BN Prospec automated analyzer |
NR |
80 |
50 |
|
Ferraro et al. |
2020 |
Italy |
Cross-sectional |
centrifuged at 3000 rpm for 10 min and stored in cryogenic tubes at −80 ◦C within two hours |
analyzed with IEF on an agarose gel followed by IgG immunoblotting |
NR |
540 |
38 |
|
Gudowska-Sawczuk et al. |
2020 |
Poland |
Cross-sectional |
−80 ◦C |
NR |
RRMS |
76 |
NR |
|
Hassan-Smith et al. |
2014 |
UK |
Cross-sectional |
-80 °C |
BN II nephelometer |
RRMS/ PPMS |
160 |
RRMS: 40, PPMS:51 |
|
Hegen et al. |
2019 |
Austria |
Cross-sectional |
NR |
FreeLite |
NR |
120 |
39 |
|
Leurs et al. |
2018 |
Netherlands, Spain, France, Belgium, Hungary, Italy, Poland, Turkey, Denmark, Serbia, Austria, and Switzerland |
Cross-sectional |
2 hours at −80°C |
FreeLite |
RRMS/SPMS/PPMS |
745 |
38 |
|
Martins et al. |
2022 |
Portugal |
Cross-sectional |
− 80 ◦C |
BN II |
NR |
191 |
44 |
|
Mene´ndez-Valladares et al. |
2015 |
Spain |
Cross-sectional |
− 80 ◦C |
Siemens BN II analyzer |
RRMS |
176 |
45.7 |
|
Passerini et al. |
2016 |
Italy |
Cross-sectional |
CSF and serum samples were centrifuged 10 min at 800 rpm and 10 min at 3000 rpm, and were stored at −20∘C |
BNII |
NR |
100 |
37.4 |
|
Perez et al. |
2019 |
Italy |
Cross-sectional |
NR |
NR |
NR |
160 |
37.7 |
|
Pieri et al. |
2017 |
Italy |
Cross-sectional |
−80 °C |
BN Prospec |
NR |
176 |
NR |
|
Presslauer et al. |
2008 |
Austria |
Cross-sectional |
−80 °C |
FreeLite |
RRMS/ PPMS |
438 |
NR |
|
Presslauer et al. |
2015 |
Austria/ Germany |
Cross-sectional |
centrifugation after the blood samples were allowed to clot for ⩾ 30 minutes |
FreeLite |
NR |
180 |
39 |
|
Puthenparampil et al. |
2018 |
Italy |
Retrospective cross-sectional |
−80 °C |
FreeLite and BNII |
RRMS |
107 |
NR |
|
Rosenstein et al. |
2021 |
Sweden |
Cross-sectional |
NR |
N Latex FLC kappa kit |
RRMS, PPMS, CIS, and SPMS |
327 |
41 |
|
Saadeh et al. |
2022 |
USA |
Cross-sectional |
−20°C or −80°C |
BNII nephelometric |
NR |
Retrospective:702, Prospective:657 |
Retrospective:54.3, Prospective:56.5 |
|
Senel et al. |
2019 |
Germany |
Cross-sectional |
NR |
FreeLite |
NR |
1224 |
37 |
|
Valencia-Vera et al. |
2017 |
Spain |
Cross-sectional |
−20 °C/ centrifugation after the blood samples were allowed to clot for ≥30 min |
FreeLite and BN ProSpec |
NR |
122 |
NR |
|
Vasilj et al. |
2018 |
Croatia |
Cross-sectional |
An aliquot of serum and CSF was stored at +4 °C until 7 days, and another was stored at -20 °C until 30 days |
BNII nephelometric |
NR |
151 |
NR |
|
Vecchio et al. |
2020 |
Italy |
Cross-sectional |
NR |
BNII nephelometric |
RRMS, PPMS, CIS, and SPMS |
373 |
51.1 |
|
NR, Not Reported; MS, Multiple Sclerosis; RRMS, relapsing remitting multiple sclerosis; SPMS, secondary progressive multiple sclerosis; CIS, clinically isolated syndrome |
||||||||
Method and Materials
The current systematic review and meta-analysis were performed according to the Preferred Reporting for Systematic Review and Meta-Analysis (PRISMA) consensus statement (25).
Literature search strategy
Three electronic databases including PubMed, Scopus, and Web of Science were searched for published literature and reviewed abstracts. The search strategy was built around concepts of “free light chain”, “kappa”, and “Multiple Sclerosis”. Also, the reference list of articles was reviewed to identify additional potential studies.
Eligibility criteria
The eligible studies should meet the following criteria: 1) Measured and reported CSF κFLC level or κ index in adults with MS, 2) existence of a comparing group (e.g., control, CIS, Neuromyelitis optica spectrum disorders (NMOSD), Neurological diseases (ND). Non-inflammatory neurological diseases (NIND), inflammatory neurological diseases (IND), and …), 3) the number of participants more than 10, 4) defined diagnostic criteria. Moreover, the papers had to describe CSF sampling and storage techniques to ensure sufficient quality. There was no language restriction. Also, patients with any subtypes, disease duration, disability, and comorbidities were included.
Study selection
The studies were screened in the two-step process by two independent investigators (T.M, M.M). First, the title and abstracts retrieved from online databases were screened, and irrelevant studies were excluded. Then, the full text of remained papers was carefully reviewed, and included studies were selected based on our eligibility criteria. Any disagreements through the screening were resolved by consultation with the third researcher (F.N).
Data extraction
|
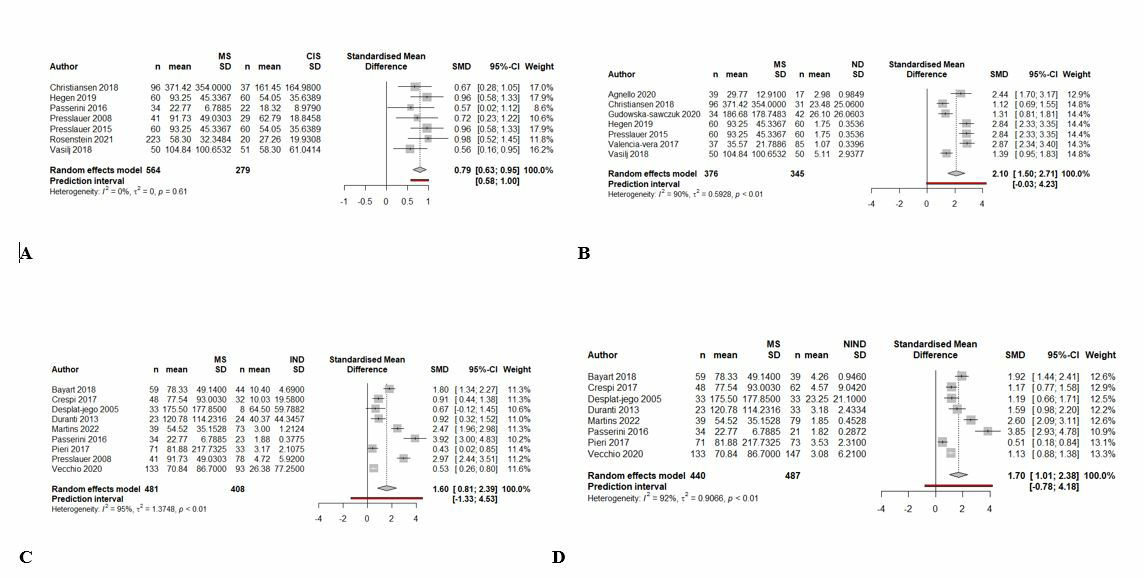
Figure 3. Forest plot of κ index in MS compared to CIS (A), ND (B), IND (C), and NIND (D)
|
The following information was manually extracted from the eligible studies by the same investigators (T.M, M.M): Study’s demographics, preanalytical condition, measuring equipment, the subtype of MS, age, number of subjects in each group, mean κ index, SD of κ index, mean CSF κFLC, SD of CSF κFLC, proposed cutoff, sensitivity, specificity, and AUC. The final data was reviewed by a third researcher (F.N).
Quality assessments
The risk of bias among included studies was assessed using studies the quality assessment of diagnostic accuracy studies (QUADAS-2) criteria (26).
Statistical analysis
The statistical analysis was performed using R 4.1.2 software. For diagnostic test accuracy (DTA) analysis, the number of patients in each control (n1) and experimental (n2) groups, sensitivity (Se), and specificity (Sp) were collected from each study. Then similar data was put into the same subgroups based on the control type MS type pairs for pooling. Using collected data (n1, n2, Se & Sp) contingency table was created and true positive (TN), true negative (TN), false positive (FP), and false negative were calculated. These parameters were used in the "madad" function to calculate the confidence interval for each study's reported Se & SP and also calculate pooled sensitivity and specificity and their respective confidence intervals (CI) using the "Wilson" approach for univariate analysis. The results of the univariate analysis are reported in forest plots for both Se and SP for each subgroup.
A bivariate approach (Reitsma et al) has been used to estimate sensitivity and specificity across studies accounting for between-study heterogeneity. Results are provided as Receiver Operating Curve (ROC) for each study and their CIs are illustrated. Also, a Summary Receiver Operating Curve is calculated for the bivariate model with CI and predictive interval indicated.
To examine the effect of cut-off used for serum κ index in MS-total group subgroup analysis was performed, dividing the studies into two subgroups with "cut-off less than 8" and "cut-off greater than 8" and their pooled Se & Sp and Area under the curve (AUC) was calculated for comparison.
To see if there is a meaningful difference in CSF κFLC level and κ index between MS patients and control groups a random effect model was used to pool standardized mean difference (SMD) in different subgroups and results are reported in forest plots with pooled effect size, CI and predictive interval.
Results
Study selection
Eight hundred and thirteen studies were identified via database search (Figure 1). After duplicate removal, 516 papers were screened. Finally, after a two-step review, 31 studies with a total of 9324 subjects were included in our qualitative and quantitative synthesis (27-57).
Among the included studies, 30 were cross-sectional (27-30, 32-57), and one was cohort (31). The demographical and clinical characteristics of the included studies are summarized in Table 1. According to the results of the QUADAS-2 assessment, the risk of bias was low among the included studies (Table 2).
The mean difference of the CSF κFLC and κ index
We compared the level of CSF κFLC in MS patients with IND, NIND, and ND. Our results demonstrated that the level of CSF κFLC was significantly higher in MS patients compared to ND
|
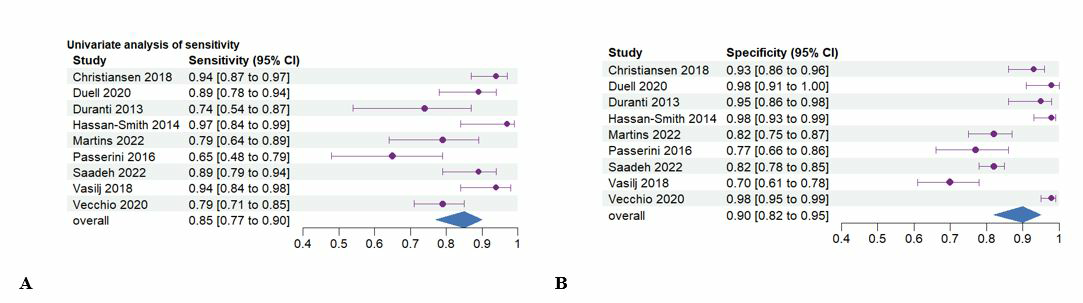
Figure 4. Forest plot of sensitivity (A) and specificity (B) of CSF κFLC levels in detecting MS from other groups |
|
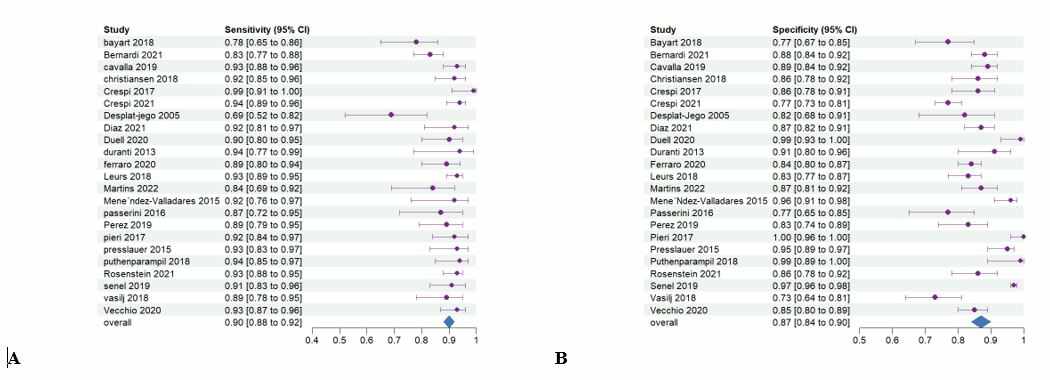
Figure 5. Forest plot of sensitivity (A) and specificity (B) of κ index in detecting MS from other groups |
|
Figure 6. Sensitivity and specificity of κ index in detecting MS from other groups based on cut-off points |
subjects (SMD = 1.58 [0.67, 1.5], I2= 95%, prediction interval= [-1.97, 5.13]) (Figure 2). Moreover, we compared the level of CSF κFLC in MS vs IND patients. We found a higher level of CSF κFLC in MS patients (SMD = 0.91 [0.55, 1.27], I2= 75%, prediction interval= [-0.26, 2.08]). Also, the level of CSF κFLC was significantly higher in MS patients when compared to NIND subjects (SMD = 0.95 [0.50, 1.39], I2= 93%, prediction interval= [-0.63, 2.52]).
The data were subjected to additional analysis to investigate the κ index difference in MS patients compared to individuals with IND, NIND, ND, and CIS. It was found that the κ index was significantly higher in MS patients compared to subjects with CIS (SMD = 0.79 [0.63, 0.95], I2= 0%, prediction interval= [0.58, 1.0]) (Figure 3). It is interesting to note that the prediction interval for future studies was close to our confidence interval and it was well above zero. Also, the κ index was significantly higher in MS patients compared to patients with ND (SMD = 2.1 [1.50, 2.71], I2= 90%, prediction interval= [-0.03, 4.23]). Furthermore, our analysis showed that the mean standardized κ index in MS patients was 1.60 higher than individuals with IND (SMD = 1.60 [0.81, 2.39], I2= 95%, prediction interval= [-1.33, 4.53]). Meta-analysis of MS vs NIND patients showed a higher κ index in subjects with MS
|
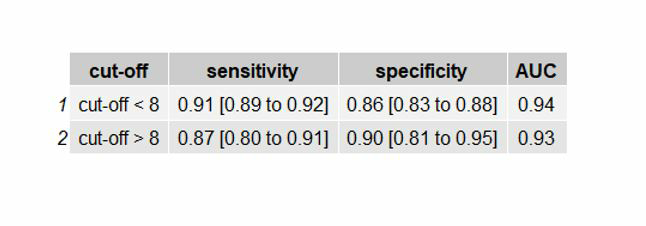
Figure 7. Forest plot of sensitivity (A) and specificity (B) of κ index in detecting MS from ND
|
(SMD = 1.70 [1.01, 2.38], I2= 92%, prediction interval= [-0.78, 4.18]).
Diagnostic accuracy of CSF κFLC and κ index
Our analysis showed that the overall sensitivity and specificity of CSF κFLC in the diagnosis of MS from other groups was 85% (CI: [0.77- 0.90]) and 90% (CI: [0.82- 0.95]) (Figure 4).
Further analysis for the κ index demonstrated sensitivity and specificity of 90% (CI: [0.88- 0.92]) and 87% (CI: [0.84- 0.90]) for detecting MS from all other groups (Figure 5). We performed a sub-group analysis based on the proposed cut-off points for the κ index among included studies. Meta-analysis showed that the sensitivity and specificity of the κ index in the diagnosis of MS from other groups was 91% (CI: [0.89- 0.92]) and 86% (CI: [0.83- 0.88]) while the AUC was 0.94 when the cut-off point was lower than 8 (Figure 6). Also, at the cut-off point>8, the sensitivity and specificity were 87% (CI: [0.80- 0.91]) and 90% (CI: [0.81- 0.95]) and AUC was 0.93.
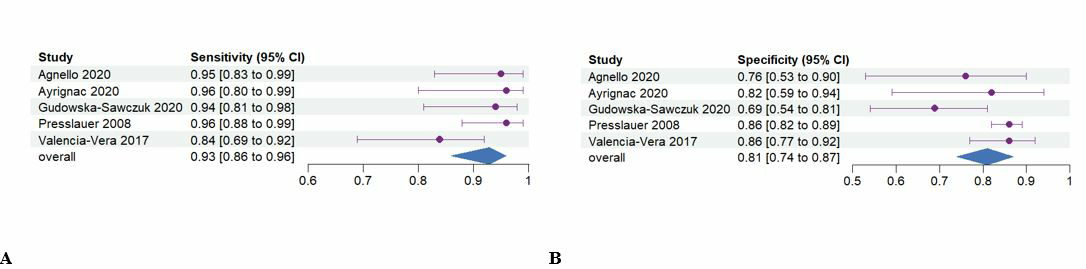
Moreover, we attempt to investigate the diagnostic accuracy of the κ index in the detection of MS from ND patients and our analysis showed 93% sensitivity (CI: [0.86- 0.96]) and specificity of 81% (CI: [0.74- 0.87]) (Figure 7). Also, the results of the bivariate analysis are presented as SROC in figure 8. Also pooled sensitivity, specificity and AUC calculated using bivariate analysis are shown in Table 3. The area under the curve (AUC) was high in every calculated group for κ index and CSF κFLC. Regarding the small confidence interval, small prediction interval, and high AUC, specificity, and sensitivity values of the κ index; it can be concluded that the κ index is a potential biomarker to distinguish MS from other (Neurological) diseases with great accuracy and high reliability (small confidence and predictive intervals).
Also, the results of the bivariate analysis are presented as SROC in figure 8.
|
Table2. Results of risk of bias assessments of included studies |
||||
|
|
PATIENT SELECTION |
INDEX TEST |
REFERENCE STANDARD |
FLOW AND TIMING |
|
Agnello et al. |
Low |
Unclear |
Low |
Low |
|
Ayrignac et al. |
Low |
Low |
Low |
Low |
|
Bayart et al. |
Unclear |
Low |
Low |
Unclear |
|
Bernardi et al. |
High |
Low |
Low |
Low |
|
Cavalla et al. |
Low |
Low |
Low |
Unclear |
|
Christiansen et al. |
High |
Unclear |
Low |
Low |
|
Crespi et al. |
Low |
High |
Unclear |
Low |
|
Crespi et al. |
Low |
Low |
Low |
Low |
|
Desplat-jego et al. |
Low |
Low |
Low |
Low |
|
Diaz et al. |
Low |
Low |
Low |
Unclear |
|
Duell et al. |
Low |
Low |
Low |
Low |
|
Duranti et al. |
Unclear |
High |
Low |
Low |
|
Ferraro et al. |
Low |
Low |
Low |
Low |
|
Gudowska-Sawczuk et al. |
Low |
Unclear |
Low |
High |
|
Hassan-Smith et al. |
High |
Low |
Low |
Low |
|
Hegen et al. |
Unclear |
Low |
Low |
Low |
|
Leurs et al. |
Low |
High |
Low |
Low |
|
Martins et al. |
Low |
Low |
Low |
Low |
|
Mene´ndez-Valladares et al. |
Low |
Unclear |
Low |
Unclear |
|
Passerini et al. |
Low |
Low |
Low |
Low |
|
Perez et al. |
Low |
Low |
Unclear |
Low |
|
Pieri et al. |
Unclear |
Low |
Low |
Low |
|
Presslauer et al. |
Unclear |
Low |
Low |
Low |
|
Presslauer et al. |
High |
Low |
Low |
Low |
|
Puthenparampil et al. |
Low |
Low |
Unclear |
Low |
|
Rosenstein et al. |
Low |
Low |
Low |
Low |
|
Saadeh et al. |
High |
Low |
Low |
Low |
|
Senel et al. |
Low |
Unclear |
Low |
Unclear |
|
Valencia-Vera et al. |
Low |
Low |
Low |
Unclear |
|
Vasilj et al. |
Low |
Low |
High |
Low |
|
Vecchio et al. |
Unclear |
Low |
Low |
Low |
|
|
||||
|
Table3. Results of pooled sensitivity, specificity and AUC calculated using bivariate analysis |
|||
|
|
sensitivity |
specificity |
AUC |
|
CSF κFLC for detecting MS from all other groups |
0.855 [0.777 to 0.909] |
0.910 [0.822 to 0.957] |
0.931 |
|
κ index for detecting MS from all other groups |
0.901 [0.878 to 0.920] |
0.876 [0.841 to 0.904] |
0.943 |
|
κ index for detecting MS from ND |
0.929 [0.865 to 0.964] |
0.816 [0.743 to 0.881] |
0.937 |
|
κFLC, kappa free light chain; ND, Neurological diseases; AUC, Area under the curve |
|||
|
Figure 8. SROC curve of the Retisma model. Triangle: summary point. Circle: individual studies. Solid closed curve: 95% confidence interval of summary point. Dashed closed curve: 95% prediction interval. Solid line: curve proposed by Rutter & Gatsonis.
|
Discussion
Our meta-analysis revealed statistically significant elevations in the CSF κFLC and κ index MS patients compared to IND, NIND, and ND groups. Our results also demonstrate that the κ index was significantly higher in MS patients compared to subjects with CIS. In the latter finding, we observed minimal heterogeneity and a small prediction interval, which implies that this finding is highly reliable and replicable in future studies. Notably, the measurement of the κ index holds potential significance for evaluating and managing CIS, which is a preliminary episode of demyelinating symptoms that may or may not progress into MS (64). Early and precise risk stratification is essential as it enables the prompt initiation of appropriate treatment (65).
Our diagnostic test accuracy meta-analysis found that the κ index had a pooled sensitivity and specificity of 90% and 87% for differentiating MS from other groups. The subgroup analysis revealed that the κ index demonstrated acceptable diagnostic capability in determining MS from other neurologic disorders (AUC>0.9). However, it was noted that the κFLC index showed slightly lower sensitivity than the κ index, making it a less optimal choice as a screening tool. However, the specificity of CSF κFLC was marginally higher than the κ index. Further subgroup meta-analysis suggested that a cut-off value of less than 8 for the κ index results in a higher sensitivity, which is desirable when considering its use as a screening tool.
Growing evidence indicates that B cells play a critical role in the progression of MS by contributing to its inflammatory and neurodegenerative elements (66, 67) via the interplay of both antibody-dependent and antibody-independent pathways (68, 69). OCBs reflect the presence of groups of immunoglobulins, and the presence of two or more of them in the CSF, when the exact bands are not detectable in the corresponding serum, is a hallmark of a humeral inflammatory response within CNS detected by flow cytometry (70, 71). Several studies have reported a correlation between the presence of OCBs and the extent of disability experienced by MS patients (72, 73). These findings highlight the importance of OCBs as a potential biomarker in the prognosis of MS (74, 75). The gold-standard method for detecting inflammation within the CNS has been the assessment of OCBs (76, 77). The OCBs change during COVID-19, and other comorbidities related to insulin resistance is reported by several studies (78-80).
The presence of locally synthesized κFLCs in the CNS of MS patients serves as an additional marker of an ongoing intrathecal inflammatory response (81, 82). Measuring the levels of κFLC and albumin in both CSF and serum enables the determination of intrathecal κFLC production through the calculation of the κ index, which also includes information on blood-brain barrier permeability (83, 84). In recent years, the κ index has gained increasing recognition as a quantitative diagnostic tool in MS, offering a potential alternative to the traditional OCB measurement (85, 86). This index possesses several methodological advantages over OCBs, including automation, independence from subjective interpretation, quantifiability, ease of performance, and cost-effectiveness (21, 25). κFLC measurement is also effective in predicting the risk of a subsequent clinical episode in patients presenting with an initial clinical manifestation of demyelination (87-91). Previous studies have shown that the κ index is an effective diagnostic tool for both CIS, with comparable sensitivity and specificity to the OCB (58, 92-94). In a different study, the κ index is shown to be more sensitive yet less specific than OCB for detecting MS. However, according to another study, the absence of high κFLC levels is more valuable in excluding MS, while OCBs are more crucial for establishing the diagnosis (84). Overall, according to the existing literature and our meta-analysis, we recommend incorporating the κ index measurement as the initial screening step in the diagnostic algorithms for patients with suspected MS and CIS (33, 95). An MRI diagnosis of MS involves detecting lesions or abnormalities in the brain and spinal cord, which appear as bright or dark spots on the scan, indicating areas where the immune system has damaged the protective myelin sheath around nerves (96).
Our meta-analysis had a few limitations, mainly inherent to the nature of the original studies that were included. For instance, administering corticosteroids before sample collection in some of the included studies may affect the serum κFLC concentrations (89, 97) and introduce bias in results. However, the lack of detail on corticosteroid consumption status prevented us from conducting a meta-regression. Also, using different versions of McDonald's criteria to define subgroups among included studies might be a source of bias. Additionally, the results of our meta-analysis were limited by substantial heterogeneity present in the majority of subgroup analyses. However, the subgroup analysis comparing CIS and MS demonstrated low levels of heterogeneity, which enhances the credibility of the results obtained. Regarding the strengths of our study, it is noteworthy that it is the largest meta-analysis conducted on the existing evidence and the first to perform subgroup analysis on differences in κFLC and κ index levels between MS and other commonly misdiagnosed conditions, namely IND and CIS. Additionally, this meta-analysis utilized the SMD statistic to control for the impact of the different methodologies employed in the included original studies.
The current body of research supports the significance of κFLC and κ index as predictors of MS progression (98, 99). However, additional studies are required to confirm the prognostic value of κFLC and κ index in MS. Future studies are also needed to investigate the correlation between κFLC levels, disease activity, and treatment response in MS patients, as well as to determine the diagnostic utility and treatment guiding potential of κFLC. Additionally, Future studies with higher statistical power should be conducted to establish a reliable guideline and universal cut-off for using the κ index as a diagnostic or screening tool in clinical practice.
Conclusion
Our meta-analysis revealed that both the κFLC and κ index are effective biomarkers for distinguishing MS from other neurological diseases. Our results also showed that the κ index is significantly higher in MS patients compared to CIS and other IND patients. Thus, we strongly recommend incorporating the κ index into MS diagnosis protocols.
Deceleration
Funding
We do not have any financial support for this study.
Conflict of interest
The author declares no conflict of interest regarding the publication of this paper.
Ethical approval
Not applicable
Availability of data and material
The datasets analyzed during the current study are available upon request with no restriction.
Consent for publication
This manuscript has been approved for publication by all authors.
Author Contributions
FN, MM, PV, and FS: Designed the study, analyzed the data, and wrote the paper; FN, MM and TM: collected data and interpreted the data, and wrote the draft version of the manuscript. The manuscript was revised and approved by all authors.
| 1. Wingerchuk DM, Lucchinetti CF, Noseworthy JH. Multiple sclerosis: current pathophysiological concepts. Laboratory investigation. 2001;81(3):263-81. https://doi.org/10.1038/labinvest.3780235 PMid:11310820 |
||||
| 2. Entezami MaH, H. Green Drug Supply Chain Investigation by Time-Market Balance and Risk. World Journal of Engineering and Technology. 2023(11):611-31. https://doi.org/10.4236/wjet.2023.113042 |
||||
| 3. Gómez-Moreno M, Díaz-Sánchez M, Ramos-González A. Application of the 2010 McDonald criteria for the diagnosis of multiple sclerosis in a Spanish cohort of patients with clinically isolated syndromes. Multiple Sclerosis Journal. 2012;18(1):39-44. https://doi.org/10.1177/1352458511417828 PMid:21865413 |
||||
| 4. Movahed F, Heidari E, Sadeghi D, Rezaei Nejad A, Abyaneh R, Zarei M, et al. Incident diabetes in adolescents using antidepressant: a systematic review and meta-analysis. European Child & Adolescent Psychiatry. 2024. https://doi.org/10.1007/s00787-024-02502-x PMid:38914830 |
||||
| 5. Comi G, Filippi M, Barkhof F, Durelli L, Edan G, Fernández O, et al. Effect of early interferon treatment on conversion to definite multiple sclerosis: a randomised study. The Lancet. 2001;357(9268):1576-82. https://doi.org/10.1016/S0140-6736(00)04725-5 PMid:11377645 |
||||
| 6. Goodin D, Bates D. Treatment of early multiple sclerosis: the value of treatment initiation after a first clinical episode. Multiple Sclerosis Journal. 2009;15(10):1175-82. https://doi.org/10.1177/1352458509107007 PMid:19737851 |
||||
| 7. Ghayedi Z, Banihashemian K, Shirdel S, Adineh Salarvand R, Zare M, zeinali s, et al. A Review on the Comparison of Working Memory Performance, Cognitive Function, and Behavioral, and Psychological Symptoms across Normal Aging, Mild Cognitive Impairment, and Alzheimer's Disease. Neurology Letters. 2024;3(Special Issue (Diagnostic and Therapeutic advances in Neurodegenerative diseases)):26-38. https://doi.org/10.61186/nl.3.2.26 |
||||
| 8. Hemmer B, Nessler S, Zhou D, Kieseier B, Hartung H-P. Immunopathogenesis and immunotherapy of multiple sclerosis. Nature Clinical Practice Neurology. 2006;2(4):201-11. https://doi.org/10.1038/ncpneuro0154 PMid:16932551 |
||||
| 9. Gastaldi M, Zardini E, Franciotta D. An update on the use of cerebrospinal fluid analysis as a diagnostic tool in multiple sclerosis. Expert review of molecular diagnostics. 2017;17(1):31-46. https://doi.org/10.1080/14737159.2017.1262260 PMid:27911122 |
||||
| 10. Thompson AJ, Banwell BL, Barkhof F, Carroll WM, Coetzee T, Comi G, et al. Diagnosis of multiple sclerosis: 2017 revisions of the McDonald criteria. The Lancet Neurology. 2018;17(2):162-73. https://doi.org/10.1016/S1474-4422(17)30470-2 PMid:29275977 |
||||
| 11. Sanz Diaz CT, de las Heras Flórez S, Carretero Perez M, Hernandez Perez MA, Martin Garcia V. Evaluation of kappa index as a tool in the diagnosis of multiple sclerosis: Implementation in routine screening procedure. Frontiers in Neurology. 2021;12:676527. https://doi.org/10.3389/fneur.2021.676527 PMid:34456842 PMCid:PMC8386692 |
||||
| 12. Mahdavimanshadi M, Anaraki MG, Mowlai M, Ahmadirad Z, editors. A Multistage Stochastic Optimization Model for Resilient Pharmaceutical Supply Chain in COVID-19 Pandemic Based on Patient Group Priority. 2024 Systems and Information Engineering Design Symposium (SIEDS); 2024 3-3 May 2024. https://doi.org/10.1109/SIEDS61124.2024.10534683 |
||||
| 13. Owjfard M, Rahimian Z, Ghaderpanah R, Rafiei E, Sadrian S, Sabaghan M, et al. Therapeutic Effects of Intranasal Administration of Resveratrol on the Rat Model of Brain Ischemia. Heliyon. 2024;10(12). https://doi.org/10.1016/j.heliyon.2024.e32592 PMid:38952360 PMCid:PMC11215267 |
||||
| 14. Laman J, Thompson E, Kappos L. Body fluid markers to monitor multiple sclerosis: the assays and the challenges. Multiple Sclerosis Journal. 1998;4(3):266-9. https://doi.org/10.1191/135245898678909556 https://doi.org/10.1177/135245859800400334 PMid:9762687 |
||||
| 15. Presslauer S, Milosavljevic D, Huebl W, Parigger S, Schneider-Koch G, Bruecke T. Kappa free light chains: diagnostic and prognostic relevance in MS and CIS. PloS one. 2014;9(2):e89945. https://doi.org/10.1371/journal.pone.0089945 PMid:24651567 PMCid:PMC3940961 |
||||
| 16. Senel M, Tumani H, Lauda F, Presslauer S, Mojib-Yezdani R, Otto M, et al. Cerebrospinal fluid immunoglobulin kappa light chain in clinically isolated syndrome and multiple sclerosis. PloS one. 2014;9(4):e88680. https://doi.org/10.1371/journal.pone.0088680 PMid:24695382 PMCid:PMC3973621 |
||||
| 17. Valencia-Vera E, Garcia-Ripoll AM-E, Enguix A, Abalos-Garcia C, Segovia-Cuevas MJ. Application of κ free light chains in cerebrospinal fluid as a biomarker in multiple sclerosis diagnosis: Development of a diagnosis algorithm. Clinical Chemistry and Laboratory Medicine (CCLM). 2018;56(4):609-13. https://doi.org/10.1515/cclm-2017-0285 PMid:29087953 |
||||
| 18. Bracco F, Gallo P, Menna R, Battistin L, Tavolato B. Free light chains in the CSF in multiple sclerosis. Journal of neurology. 1987;234:303-7. https://doi.org/10.1007/BF00314285 PMid:3112315 |
||||
| 19. Presslauer S, Milosavljevic D, Brücke T, Bayer P, Hübl W. Elevated levels of kappa free light chains in CSF support the diagnosis of multiple sclerosis. Journal of neurology. 2008;255:1508-14. https://doi.org/10.1007/s00415-008-0954-z PMid:18685917 |
||||
| 20. Menendez-Valladares P, García-Sánchez MI, Martínez MA, Silva JLGDV, Guitarte CB, Ayuso GI. Validation and meta-analysis of kappa index biomarker in multiple sclerosis diagnosis. Autoimmunity Reviews. 2019;18(1):43-9. https://doi.org/10.1016/j.autrev.2018.07.010 PMid:30408586 |
||||
| 21. Duranti F, Pieri M, Centonze D, Buttari F, Bernardini S, Dessi M. Determination of kFLC and K Index in cerebrospinal fluid: A valid alternative to assessintrathecal immunoglobulin synthesis. Journal of neuroimmunology. 2013;263(1-2):116-20. https://doi.org/10.1016/j.jneuroim.2013.07.006 PMid:23916392 |
||||
| 22. Hassan-Smith G, Durant L, Tsentemeidou A, Assi L, Faint J, Kalra S, et al. High sensitivity and specificity of elevated cerebrospinal fluid kappa free light chains in suspected multiple sclerosis. Journal of Neuroimmunology. 2014;276(1-2):175-9. https://doi.org/10.1016/j.jneuroim.2014.08.003 PMid:25146968 |
||||
| 23. Krakauer M, Nielsen HS, Jensen J, Sellebjerg F. Intrathecal synthesis of free immunoglobulin light chains in multiple sclerosis. Acta neurologica scandinavica. 1998;98(3):161-5. https://doi.org/10.1111/j.1600-0404.1998.tb07287.x PMid:9786611 |
||||
| 24. Desplat-Jégo S, Feuillet L, Pelletier J, Bernard D, Chérif AA, Boucraut J. Quantification of immunoglobulin free light chains in cerebrospinal fluid by nephelometry. Journal of Clinical Immunology. 2005;25:338-45. https://doi.org/10.1007/s10875-005-5371-9 PMid:16133990 |
||||
| 25. Rosenstein I, Rasch S, Axelsson M, Novakova L, Blennow K, Zetterberg H, et al. Kappa free light chain index as a diagnostic biomarker in multiple sclerosis: A real‐world investigation. Journal of Neurochemistry. 2021;159(3):618-28. https://doi.org/10.1111/jnc.15500 PMid:34478561 |
||||
| 26. Hegen H, Walde J, Berek K, Arrambide G, Gnanapavan S, Kaplan B, et al. Cerebrospinal fluid kappa free light chains for the diagnosis of multiple sclerosis: A systematic review and meta-analysis. Multiple Sclerosis Journal. 2023;29(2):169-81. https://doi.org/10.1177/13524585221134217 https://doi.org/10.1177/13524585221134213 PMid:36453167 PMCid:PMC9925892 |
||||
| 27. Villar LM, Espiño M, Costa-Frossard L, Muriel A, Jiménez J, Álvarez-Cermeño JC. High levels of cerebrospinal fluid free kappa chains predict conversion to multiple sclerosis. Clinica Chimica Acta. 2012;413(23-24):1813-6. https://doi.org/10.1016/j.cca.2012.07.007 PMid:22814197 |
||||
| 28. Süße M, Feistner F, Grothe M, Nauck M, Dressel A, Hannich MJ. Free light chains kappa can differentiate between myelitis and noninflammatory myelopathy. Neurology-Neuroimmunology Neuroinflammation. 2020;7(6). https://doi.org/10.1212/NXI.0000000000000892 PMid:32948648 PMCid:PMC7524577 |
||||
| 29. Aliasghar Tabatabaei Mohammadi AFM, Yasamin Pishkari, Fateme Aghaei, Atiye Janbozorgi, Atie Jan Bozorgi, Negar Teymori, Sonia Rezaei, Hamed Fallah, Mohammadreza Sobhani, Asma Dehghan, Erfan Ghanbarzadeh. Neuroscience in the 21st Century: New Tools and Techniques Driving Exciting Discoveries: Nobel Sciences. | ||||
| 30. Hegen H, Walde J, Berek K, Arrambide G, Gnanapavan S, Kaplan B, et al. Cerebrospinal fluid kappa free light chains for the diagnosis of multiple sclerosis: A systematic review and meta-analysis. Mult Scler. 2023;29(2):169-81. https://doi.org/10.1177/13524585221134217 https://doi.org/10.1177/13524585221134213 PMid:36453167 PMCid:PMC9925892 |
||||
| 31. Moher D, Liberati A, Tetzlaff J, Altman DG. Preferred reporting items for systematic reviews and meta-analyses: the PRISMA statement. BMJ. 2009;339:b2535. https://doi.org/10.1136/bmj.b2535 PMid:19622551 PMCid:PMC2714657 |
||||
| 32. Whiting PF, Rutjes AW, Westwood ME, Mallett S, Deeks JJ, Reitsma JB, et al. QUADAS-2: a revised tool for the quality assessment of diagnostic accuracy studies. Annals of internal medicine. 2011;155(8):529-36. https://doi.org/10.7326/0003-4819-155-8-201110180-00009 PMid:22007046 |
||||
| 33. Agnello L, Lo Sasso B, Salemi G, Altavilla P, Pappalardo EM, Caldarella R, et al. Clinical Use of κ Free Light Chains Index as a Screening Test for Multiple Sclerosis. Laboratory Medicine. 2020;51(4):402-7. https://doi.org/10.1093/labmed/lmz073 PMid:31943078 |
||||
| 34. Alves Martins D, Lopes J, Martins da Silva A, Morais CI, Vasconcelos J, Lima I, et al. Kappa free light chains: Diagnostic performance in multiple sclerosis and utility in a clinical laboratory. Clin Chim Acta. 2022;528:56-64. https://doi.org/10.1016/j.cca.2022.01.017 PMid:35092724 |
||||
| 35. Ayrignac X, Pons CC, Huby S, Chaudey L, Carra-Dalliere C, Charif M, et al. Kappa free light chain in multiple sclerosis: higher sensitivity but lower specificity than oligoclonal bands. (585). Neurology. 2020;94(15 Supplement):585. https://doi.org/10.1212/WNL.94.15_supplement.585 |
||||
| 36. Bayart JL, Muls N, van Pesch V. Free Kappa light chains in neuroinflammatory disorders: Complement rather than substitute? Acta Neurol Scand. 2018;138(4):352-8. https://doi.org/10.1111/ane.12969 PMid:29900542 |
||||
| 37. Bernardi G, Biagioli T, Malpassi P, De Michele T, Vecchio D, Repice AM, et al. The contribute of cerebrospinal fluid free light-chain assay in the diagnosis of multiple sclerosis and other neurological diseases in an Italian multicenter study. Mult Scler. 2022;28(9):1364-72. https://doi.org/10.1177/13524585211064121 PMid:34965771 |
||||
| 38. Cavalla P, Caropreso P, Limoncelli S, Bosa C, Pasanisi MB, Schillaci V, et al. Kappa free light chains index in the differential diagnosis of Multiple Sclerosis from Neuromyelitis optica spectrum disorders and other immune-mediated central nervous system disorders. J Neuroimmunol. 2020;339:577122. https://doi.org/10.1016/j.jneuroim.2019.577122 PMid:31837636 |
||||
| 39. Christiansen M, Gjelstrup MC, Stilund M, Christensen T, Petersen T, Jon Møller H. Cerebrospinal fluid free kappa light chains and kappa index perform equal to oligoclonal bands in the diagnosis of multiple sclerosis. Clin Chem Lab Med. 2018;57(2):210-20. https://doi.org/10.1515/cclm-2018-0400 PMid:30055097 |
||||
| 40. Crespi I, Caropreso P, Calcagno L, Lombardo F, Lamonaca M, Sedda G, et al. The Kappa Index as a valid alternative to oligoclonal bands determination in the diagnostic process of patients with multiple sclerosis. Biochimica Clinica. 2021;45(1):44-51. | ||||
| 41. Sajjadi Mohammadabadi, S. M., Seyedkhamoushi, F., Mostafavi, M., & Borhani Peikani, M. (2024). Examination of AI's role in Diagnosis, Treatment, and Patient care. In Gupta, M., Kumar, R., & Lu, Z. (Eds.), Transforming Gender-Based Healthcare with AI and Machine Learning (1st ed., pp. 221-238). CRC Press. https://doi.org/10.1201/9781003473435 | ||||
| 42. Desplat-Jégo S, Feuillet L, Pelletier J, Bernard D, Chérif AA, Boucraut J. Quantification of immunoglobulin free light chains in cerebrospinal fluid by nephelometry. J Clin Immunol. 2005;25(4):338-45. https://doi.org/10.1007/s10875-005-5371-9 PMid:16133990 |
||||
| 43. Duell F, Evertsson B, Al Nimer F, Sandin Å, Olsson D, Olsson T, et al. Diagnostic accuracy of intrathecal kappa free light chains compared with OCBs in MS. Neurology - Neuroimmunology Neuroinflammation. 2020;7(4):e775. https://doi.org/10.1212/NXI.0000000000000775 PMid:32527760 PMCid:PMC7309528 |
||||
| 44. Duranti F, Pieri M, Centonze D, Buttari F, Bernardini S, Dessi M. Determination of κFLC and κ Index in cerebrospinal fluid: a valid alternative to assess intrathecal immunoglobulin synthesis. J Neuroimmunol. 2013;263(1-2):116-20. https://doi.org/10.1016/j.jneuroim.2013.07.006 PMid:23916392 |
||||
| 45. Ferraro D, Bedin R, Natali P, Franciotta D, Smolik K, Santangelo M, et al. Kappa Index Versus CSF Oligoclonal Bands in Predicting Multiple Sclerosis and Infectious/Inflammatory CNS Disorders. Diagnostics (Basel). 2020;10(10). https://doi.org/10.3390/diagnostics10100856 PMid:33096861 PMCid:PMC7589948 |
||||
| 46. Gudowska-Sawczuk M, Tarasiuk J, Kułakowska A, Kochanowicz J, Mroczko B. Kappa Free Light Chains and IgG Combined in a Novel Algorithm for the Detection of Multiple Sclerosis. Brain Sci. 2020;10(6). https://doi.org/10.3390/brainsci10060324 PMid:32471086 PMCid:PMC7349504 |
||||
| 47. Hassan-Smith G, Durant L, Tsentemeidou A, Assi LK, Faint JM, Kalra S, et al. High sensitivity and specificity of elevated cerebrospinal fluid kappa free light chains in suspected multiple sclerosis. J Neuroimmunol. 2014;276(1-2):175-9. https://doi.org/10.1016/j.jneuroim.2014.08.003 PMid:25146968 |
||||
| 48. Hegen H, Walde J, Milosavljevic D, Aboulenein-Djamshidian F, Senel M, Tumani H, et al. Free light chains in the cerebrospinal fluid. Comparison of different methods to determine intrathecal synthesis. Clin Chem Lab Med. 2019;57(10):1574-86. https://doi.org/10.1515/cclm-2018-1300 PMid:31112501 |
||||
| 49. Leurs CE, Twaalfhoven H, Lissenberg-Witte BI, van Pesch V, Dujmovic I, Drulovic J, et al. Kappa free light chains is a valid tool in the diagnostics of MS: A large multicenter study. Mult Scler. 2020;26(8):912-23. https://doi.org/10.1177/1352458519845844 PMid:31066634 PMCid:PMC7350201 |
||||
| 50. Menéndez-Valladares P, García-Sánchez MI, Cuadri Benítez P, Lucas M, Adorna Martínez M, Carranco Galán V, et al. Free kappa light chains in cerebrospinal fluid as a biomarker to assess risk conversion to multiple sclerosis. Mult Scler J Exp Transl Clin. 2015;1:2055217315620935. https://doi.org/10.1177/2055217315620935 PMid:28607709 PMCid:PMC5433434 |
||||
| 51. Passerini G, Dalla Costa G, Sangalli F, Moiola L, Colombo B, Locatelli M, et al. Free Light Chains and Intrathecal B Cells Activity in Multiple Sclerosis: A Prospective Study and Meta-Analysis. Mult Scler Int. 2016;2016:2303857. https://doi.org/10.1155/2016/2303857 PMid:28116160 PMCid:PMC5225376 |
||||
| 52. Nikrah, P., Ghareh Chahie, R., Ghazvini, A., & Hajizadeh, A. (2024). Evaluating the effect of cochlear implantation age on pragmatic abilities before and after age of 3. Applied Neuropsychology: Child, 1–7. https://doi.org/10.1080/21622965.2024.2403100 | ||||
| 53. Pieri M, Storto M, Pignalosa S, Zenobi R, Buttari F, Bernardini S, et al. KFLC Index utility in multiple sclerosis diagnosis: Further confirmation. Journal of Neuroimmunology. 2017;309:31-3. https://doi.org/10.1016/j.jneuroim.2017.05.007 PMid:28601282 |
||||
| 54. Presslauer S, Milosavljevic D, Brücke T, Bayer P, Hübl W. Elevated levels of kappa free light chains in CSF support the diagnosis of multiple sclerosis. J Neurol. 2008;255(10):1508-14. https://doi.org/10.1007/s00415-008-0954-z PMid:18685917 |
||||
| 55. Presslauer S, Milosavljevic D, Huebl W, Aboulenein-Djamshidian F, Krugluger W, Deisenhammer F, et al. Validation of kappa free light chains as a diagnostic biomarker in multiple sclerosis and clinically isolated syndrome: A multicenter study. Mult Scler. 2016;22(4):502-10. https://doi.org/10.1177/1352458515594044 PMid:26199348 |
||||
| 56. Puthenparampil M, Altinier S, Stropparo E, Zywicki S, Poggiali D, Cazzola C, et al. Intrathecal K free light chain synthesis in multiple sclerosis at clinical onset associates with local IgG production and improves the diagnostic value of cerebrospinal fluid examination. Mult Scler Relat Disord. 2018;25:241-5. https://doi.org/10.1016/j.msard.2018.08.002 PMid:30130707 |
||||
| 57. Rosenstein I, Rasch S, Axelsson M, Novakova L, Blennow K, Zetterberg H, et al. Kappa free light chain index as a diagnostic biomarker in multiple sclerosis: A real-world investigation. J Neurochem. 2021;159(3):618-28. https://doi.org/10.1111/jnc.15500 PMid:34478561 |
||||
| 58. Saadeh RS, Bryant SC, McKeon A, Weinshenker B, Murray DL, Pittock SJ, et al. CSF Kappa Free Light Chains: Cutoff Validation for Diagnosing Multiple Sclerosis. Mayo Clinic Proceedings. 2022;97(4):738-51. https://doi.org/10.1016/j.mayocp.2021.09.014 PMid:34893322 |
||||
| 59. Sanz Diaz CT, de Las Heras Flórez S, Carretero Perez M, Hernández Pérez M, Martín García V. Evaluation of Kappa Index as a Tool in the Diagnosis of Multiple Sclerosis: Implementation in Routine Screening Procedure. Front Neurol. 2021;12:676527. https://doi.org/10.3389/fneur.2021.676527 PMid:34456842 PMCid:PMC8386692 |
||||
| 60. Senel M, Mojib-Yezdani F, Braisch U, Bachhuber F, Lewerenz J, Ludolph AC, et al. CSF Free Light Chains as a Marker of Intrathecal Immunoglobulin Synthesis in Multiple Sclerosis: A Blood-CSF Barrier Related Evaluation in a Large Cohort. Front Immunol. 2019;10:641. https://doi.org/10.3389/fimmu.2019.00641 PMid:30984199 PMCid:PMC6449445 |
||||
| 61. Valencia-Vera E, Martinez-Escribano Garcia-Ripoll A, Enguix A, Abalos-Garcia C, Segovia-Cuevas MJ. Application of κ free light chains in cerebrospinal fluid as a biomarker in multiple sclerosis diagnosis: development of a diagnosis algorithm. Clin Chem Lab Med. 2018;56(4):609-13. https://doi.org/10.1515/cclm-2017-0285 PMid:29087953 |
||||
| 62. Vasilj M, Kes VB, Vrkic N, Vukasovic I. Relevance of KFLC quantification to differentiate clinically isolated syndrome from multiple sclerosis at clinical onset. Clin Neurol Neurosurg. 2018;174:220-9. https://doi.org/10.1016/j.clineuro.2018.09.031 PMid:30278299 |
||||
| 63. Vecchio D, Bellomo G, Serino R, Virgilio E, Lamonaca M, Dianzani U, et al. Intrathecal kappa free light chains as markers for multiple sclerosis. Scientific Reports. 2020;10(1):20329. https://doi.org/10.1038/s41598-020-77029-7 PMid:33230241 PMCid:PMC7683527 |
||||
| 64. Charil A, Inglese M. Predicting short-term conversion from CIS to MS: Relevance of lesion distribution. Neurology. 2013;80(3):230-1. https://doi.org/10.1212/WNL.0b013e31827dec22 PMid:23223542 |
||||
| 65. Marcus JF, Waubant EL. Updates on Clinically Isolated Syndrome and Diagnostic Criteria for Multiple Sclerosis. The Neurohospitalist. 2013;3(2):65-80. https://doi.org/10.1177/1941874412457183 PMid:23983889 PMCid:PMC3726117 |
||||
| 66. Comi G, Bar‐Or A, Lassmann H, Uccelli A, Hartung HP, Montalban X, et al. Role of B Cells in Multiple Sclerosis and Related Disorders. Annals of Neurology. 2021;89(1):13-23. https://doi.org/10.1002/ana.25927 PMid:33091175 PMCid:PMC8007167 |
||||
| 67. Hashemikamangar SS, Farahani S, Khoshgoo S, Doroudgar P. Comparative Efficacy of Four Stain Removal Methods for Bleach-Shade Composite Resins after Immersion in Staining Solutions: An In Vitro Study. International Journal of Dentistry. 2023;2023(1):8909288. https://doi.org/10.1155/2023/8909288 PMid:37342250 PMCid:PMC10277192 |
||||
| 68. Li R, Patterson KR, Bar-Or A. Reassessing B cell contributions in multiple sclerosis. Nature Immunology. 2018;19(7):696-707. https://doi.org/10.1038/s41590-018-0135-x PMid:29925992 |
||||
| 69. Soori H, Yousefinezhadi T, Haghighat Manesh E. Epidemiologic Study of Post-Traumatic Stress Disorder (PTSD) among Traffic Accident Victims in Tehran. Iranian Journal of Epidemiology. 2021;17(3):272-80. | ||||
| 70. Link H, Huang Y-M. Oligoclonal bands in multiple sclerosis cerebrospinal fluid: An update on methodology and clinical usefulness. Journal of Neuroimmunology. 2006;180(1-2):17-28. https://doi.org/10.1016/j.jneuroim.2006.07.006 PMid:16945427 |
||||
| 71. Gholivand K, Barzegari A, Yousefian M, Malekshah RE, Faraghi M. Experimental and theoretical evaluation of biological properties of a phosphoramide functionalized graphene oxide. Biocatalysis and Agricultural Biotechnology. 2023;47:102612. https://doi.org/10.1016/j.bcab.2023.102612 |
||||
| 72. Farina G, Magliozzi R, Pitteri M, Reynolds R, Rossi S, Gajofatto A, et al. Increased cortical lesion load and intrathecal inflammation is associated with oligoclonal bands in multiple sclerosis patients: a combined CSF and MRI study. Journal of Neuroinflammation. 2017;14(1):40-. https://doi.org/10.1186/s12974-017-0812-y PMid:28222766 PMCid:PMC5319028 |
||||
| 73. Rojas* JI, Tizio* S, Patrucco L, Cristiano E. Oligoclonal bands in multiple sclerosis patients: worse prognosis? Neurological Research. 2012;34(9):889-92. https://doi.org/10.1179/1743132812Y.0000000088 PMid:22909670 |
||||
| 74. Ben Noon G, Vigiser I, Shiner T, Kolb H, Karni A, Regev K. Reinforcing the evidence of oligoclonal bands as a prognostic factor in patients with Multiple sclerosis. Multiple Sclerosis and Related Disorders. 2021;56:103220-. https://doi.org/10.1016/j.msard.2021.103220 PMid:34455137 |
||||
| 75. Rajabipoor Meybodi A, Mohammadi M, Arjmandi H. A qualitative approach to the ethical challenges of Iranian nurses during the COVID-19 pandemic. Journal of Preventive and Complementary Medicine. 2022;1(3):156-62. | ||||
| 76. Freedman MS, Thompson EJ, Deisenhammer F, Giovannoni G, Grimsley G, Keir G, et al. Recommended standard of cerebrospinal fluid analysis in the diagnosis of multiple sclerosis: a consensus statement. Arch Neurol. 2005;62(6):865-70. https://doi.org/10.1001/archneur.62.6.865 PMid:15956157 |
||||
| 77. Gholivand K, Faraghi M, Tizhoush SK, Ahmadi S, Yousefian M, Mohammadpanah F, et al. Synthesis, characterization, biological properties, and molecular docking studies of new phosphoramide-based Ag(i) complexes. New Journal of Chemistry. 2022;46(38):18326-35. https://doi.org/10.1039/D2NJ02748H |
||||
| 78. Rahimian Z, Feili A, Ghaderpanah R, Sadrian S, Hosseini SA, Ranjbar M, et al. COVID-19-associated acute pancreatitis: a systematic review of case reports. Przegląd Epidemiologiczny - Epidemiological Review. 2023;77(1):66-73. https://doi.org/10.32394/pe.77.07 PMid:37283284 |
||||
| 79. Ghavimi S, Hashemipour R, Panchal D, Nasir UM, Javidialsaadi A, Pyrsopoulos NT. 2952 Liver Transplant in Patients With Budd-Chiari Syndrome: A National Study. Official journal of the American College of Gastroenterology | ACG. 2019;114:S1606. https://doi.org/10.14309/01.ajg.0000601340.56908.e4 |
||||
| 80. Yousefian M, Abedimanesh S, Yadegar A, Nakhjavani M, Bathaie SZ. Co-administration of "L-Lysine, Vitamin C, and Zinc" increased the antioxidant activity, decreased insulin resistance, and improved lipid profile in streptozotocin-induced diabetic rats. Biomedicine & Pharmacotherapy. 2024;174:116525. https://doi.org/10.1016/j.biopha.2024.116525 PMid:38599057 |
||||
| 81. Fagnart OC, Sindic CJM, Laterre C. Free kappa and lambda light chain levels in the cerebrospinal fluid of patients with multiple sclerosis and other neurological diseases. Journal of Neuroimmunology. 1988;19(1-2):119-32. https://doi.org/10.1016/0165-5728(88)90041-0 PMid:3135296 |
||||
| 82. Konen FF, Schwenkenbecher P, Jendretzky KF, Gingele S, Sühs K-W, Tumani H, et al. The Increasing Role of Kappa Free Light Chains in the Diagnosis of Multiple Sclerosis. Cells. 2021;10(11):3056-. https://doi.org/10.3390/cells10113056 PMid:34831279 PMCid:PMC8622045 |
||||
| 83. Reiber H, Zeman D, Kušnierová P, Mundwiler E, Bernasconi L. Diagnostic relevance of free light chains in cerebrospinal fluid - The hyperbolic reference range for reliable data interpretation in quotient diagrams. Clinica Chimica Acta. 2019;497:153-62. https://doi.org/10.1016/j.cca.2019.07.027 PMid:31351929 |
||||
| 84. Leurs CE, Twaalfhoven HAM, Lissenberg-Witte BI, van Pesch V, Dujmovic I, Drulovic J, et al. Kappa free light chains is a valid tool in the diagnostics of MS: A large multicenter study. Multiple Sclerosis Journal. 2020;26(8):912-23. https://doi.org/10.1177/1352458519845844 PMid:31066634 PMCid:PMC7350201 |
||||
| 85. Gurtner KM, Shosha E, Bryant SC, Andreguetto BD, Murray DL, Pittock SJ, et al. CSF free light chain identification of demyelinating disease: comparison with oligoclonal banding and other CSF indexes. Clinical Chemistry and Laboratory Medicine (CCLM). 2018;56(7):1071-80. https://doi.org/10.1515/cclm-2017-0901 PMid:29455184 |
||||
| 86. Ghamari N, Ghaderpanah R, Sadrian SH, Fallah N. Effect of a visual dual task on postural stability-A comparative study using linear and nonlinear methods. Health Science Reports. 2023;6(8):e1437. https://doi.org/10.1002/hsr2.1437 PMid:37520463 PMCid:PMC10375842 |
||||
| 87. Rathbone E, Durant L, Kinsella J, Parker AR, Hassan-Smith G, Douglas MR, et al. Cerebrospinal fluid immunoglobulin light chain ratios predict disease progression in multiple sclerosis. Journal of Neurology, Neurosurgery & Psychiatry. 2018;89(10):1044-9. https://doi.org/10.1136/jnnp-2018-317947 PMid:29743290 PMCid:PMC6166608 |
||||
| 88. Nawaser, K., Jafarkhani, F., Khamoushi, S., Yazdi, A., Mohsenifard, H., & Gharleghi, B. (2024). The Dark Side of Digitalization: A Visual Journey of Research through Digital Game Addiction and Mental Health. IEEE Engineering Management Review, 1-27. https://doi.org/10.1109/EMR.2024.3462740 | ||||
| 89. Berek K, Bsteh G, Auer M, Di Pauli F, Grams A, Milosavljevic D, et al. Kappa-Free Light Chains in CSF Predict Early Multiple Sclerosis Disease Activity. Neurology - Neuroimmunology Neuroinflammation. 2021;8(4):e1005-e. https://doi.org/10.1212/NXI.0000000000001005 PMid:34049994 PMCid:PMC8168046 |
||||
| 90. Gaetani L, Di Carlo M, Brachelente G, Valletta F, Eusebi P, Mancini A, et al. Cerebrospinal fluid free light chains compared to oligoclonal bands as biomarkers in multiple sclerosis. Journal of Neuroimmunology. 2020;339:577108-. https://doi.org/10.1016/j.jneuroim.2019.577108 PMid:31743879 |
||||
| 91. Schwenkenbecher P, Konen F, Wurster U, Jendretzky K, Gingele S, Sühs K-W, et al. The Persisting Significance of Oligoclonal Bands in the Dawning Era of Kappa Free Light Chains for the Diagnosis of Multiple Sclerosis. International Journal of Molecular Sciences. 2018;19(12):3796-. https://doi.org/10.3390/ijms19123796 PMid:30501024 PMCid:PMC6320811 |
||||
| 92. Süße M, Hannich M, Petersmann A, Zylla S, Pietzner M, Nauck M, et al. Kappa free light chains in cerebrospinal fluid to identify patients with oligoclonal bands. European Journal of Neurology. 2018;25(9):1134-9. https://doi.org/10.1111/ene.13667 PMid:29683546 |
||||
| 93. Christiansen M, Gjelstrup MC, Stilund M, Christensen T, Petersen T, Jon Møller H. Cerebrospinal fluid free kappa light chains and kappa index perform equal to oligoclonal bands in the diagnosis of multiple sclerosis. Clinical Chemistry and Laboratory Medicine (CCLM). 2018;57(2):210-20. https://doi.org/10.1515/cclm-2018-0400 PMid:30055097 |
||||
| 94. Presslauer S, Milosavljevic D, Huebl W, Parigger S, Schneider-Koch G, Bruecke T. Kappa Free Light Chains: Diagnostic and Prognostic Relevance in MS and CIS. PLoS ONE. 2014;9(2):e89945-e. https://doi.org/10.1371/journal.pone.0089945 PMid:24651567 PMCid:PMC3940961 |
||||
| 95. Atashzar MR, Ataollahi MR, Asad AG, Doroudgar P, Amani D. The effects of tumor-derived exosomes enriched with miRNA-211a on B16F10 cells. Contemporary Oncology/Współczesna Onkologia. 2024;28(2):121-9. https://doi.org/10.5114/wo.2024.142364 PMid:39421705 PMCid:PMC11480909 |
||||
| 96. Benchari M, Totaro MW, editors. MRI Brain Cancer Image Detection: Application of an Integrated U-Net and ResNet50 Architecture2024; Cham: Springer Nature Switzerland. https://doi.org/10.1007/978-3-031-66535-6_12 |
||||
| 97. Montazeri Ghahjavarestani A, Haghighat-Manesh E, Atashpanjeh H, Behfar A, Zeynali S, Ghahri Lalaklou Z. An investigation into the social and behavioral interactions of kids with autism and their perspectives on the topic of sensory training. Neurology Letters. 2024;3(2):5-12. https://doi.org/10.61186/nl.3.3.5 |
||||
| 98. Salavisa M, Paixão P, Ladeira AF, Mendes A, Correia AS, Viana JF, et al. Prognostic value of kappa free light chains determination in first-ever multiple sclerosis relapse. Journal of Neuroimmunology. 2020;347:577355-. https://doi.org/10.1016/j.jneuroim.2020.577355 PMid:32795735 |
||||
| 99. Vecchio D, Crespi I, Virgilio E, Naldi P, Campisi MP, Serino R, et al. Kappa free light chains could predict early disease course in multiple sclerosis. Multiple Sclerosis and Related Disorders. 2019;30:81-4. https://doi.org/10.1016/j.msard.2019.02.001 PMid:30738877 |
||||

| Article View | 1,197 |
| PDF Download | 548 |